Logistics KPIs for eCommerce are becoming the backbone of how modern brands measure performance, control costs, and deliver consistent customer experiences.
Nearly 48% of online shoppers abandon carts due to high shipping costs, while 90%+ expect accurate and on-time delivery as a basic standard. In high-return categories like fashion, return rates can go up to 20 – 30%, and even a 1–2 day delay can reduce the chances of a repeat purchase.
This is exactly why tracking these metrics matters. Without clear visibility, teams often don’t know where delays are happening, why costs are increasing, or what’s causing returns and failed deliveries. Over time, these small gaps turn into lost revenue, higher RTOs, and poor customer retention.
Logistics KPIs are measurable indicators that track how efficiently orders move from checkout to delivery and even returns. They help businesses understand what’s working, what’s slowing them down, and where to improve, turning day-to-day operations into informed, better decisions.
Why eCommerce Logistics KPIs Matter More Than Ever
Customer expectations haven’t changed loudly, but they’ve changed deeply. Today, fast delivery isn’t something customers appreciate, it’s something they assume. Real-time tracking is no longer a feature, it’s expected. Returns need to feel effortless, and at the same time, shipping costs can’t feel too high.
This shift has quietly raised the bar for ecommerce operations. A large share of customers abandon their carts because of high shipping costs. Delivery delays don’t just cause complaints, they reduce the chances of customers coming back. In categories like fashion, return rates can go as high as 20–30%, and inefficiencies across logistics can increase overall costs by 15–25%.
This is where eCommerce logistics KPIs start becoming essential, not optional. They bring clarity into what’s actually happening behind the scenes, where delays are occurring, which carriers are underperforming, and where costs are quietly increasing.
Without tracking the right metrics, most teams are left reacting instead of improving. They struggle to pinpoint bottlenecks, miss opportunities to optimize shipping decisions, and end up operating without full visibility. The difference isn’t just operational, it directly impacts customer experience, margins, and long-term growth.
eCommerce Logistics Metrics: 21 KPIs That Actually Drive Performance
In eCommerce, growth doesn’t break because of demand, it breaks because operations can’t keep up. Orders increase, but so do delays, returns, and costs. What looks like small inefficiencies in shipping or fulfillment quickly turn into lost customers and shrinking margins.
That’s why tracking the right logistics metrics is no longer optional. It’s how teams move from guessing what’s wrong to actually knowing what to fix. The KPIs below aren’t just numbers, they’re signals that tell you where your operations are strong, and where they need attention
Key Logistics Performance Indicators Across Delivery, Cost, and Experience
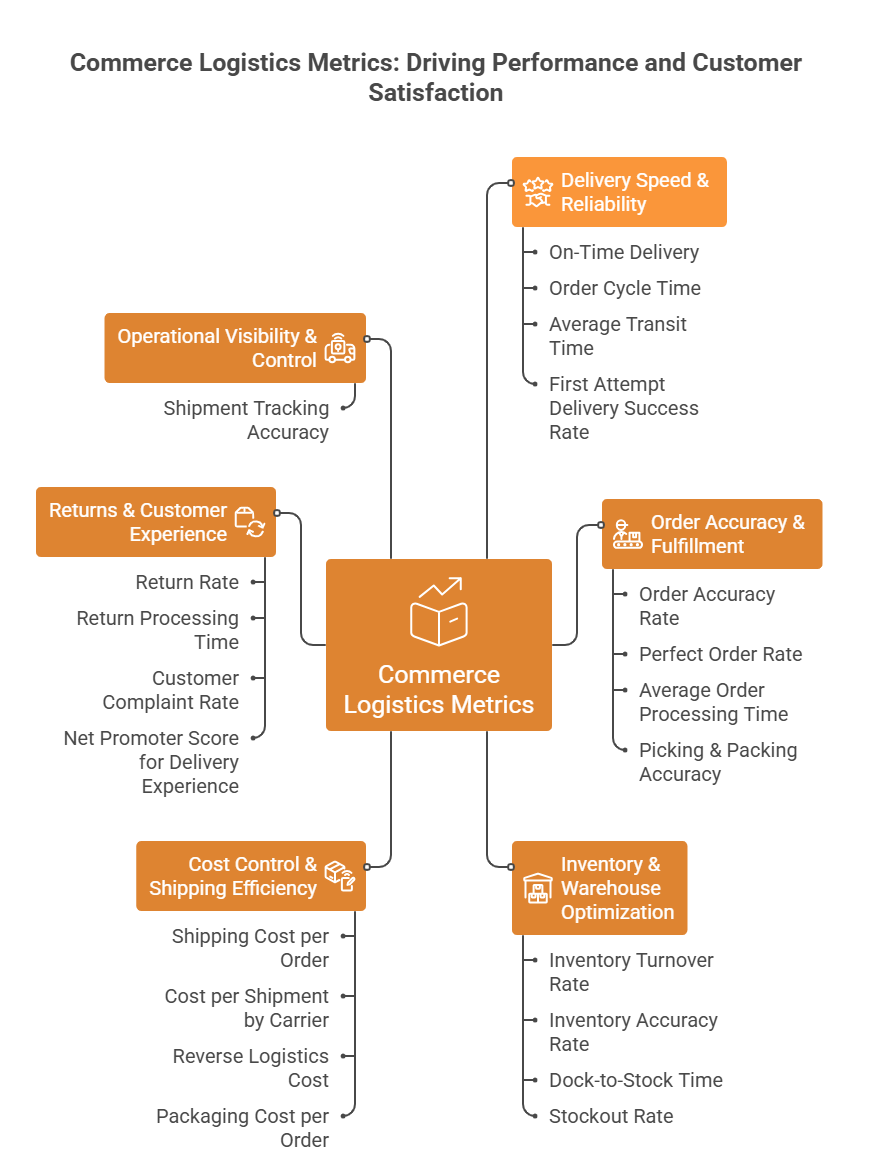
- On-Time Delivery (OTD)
Measures the percentage of orders delivered within the promised timeline. It directly reflects customer trust and carrier performance. A consistently high OTD also reduces WISMO (“Where is my order?”) queries. - Order Cycle Time
Tracks the total time from order placement to final delivery. It helps uncover delays across order processing, warehouse handling, and last-mile delivery. - Average Transit Time
Focuses only on the shipping duration after dispatch. This is useful when comparing carrier performance across different regions. - First Attempt Delivery Success Rate
Shows how often orders are delivered successfully on the first attempt. Lower rates often point to address issues, customer availability, or poor carrier coordination.
Order Accuracy & Fulfillment Efficiency Metrics
- Order Accuracy Rate
Measures how many orders are delivered without errors. Mistakes like wrong or missing items directly increase returns and customer dissatisfaction. - Perfect Order Rate
Tracks orders that are delivered on time, complete, undamaged, and with correct documentation. It’s one of the most complete indicators of operational quality. - Average Order Processing Time
Captures the time taken from order placement to dispatch. Delays here usually indicate internal bottlenecks in warehouse or system workflows. - Picking & Packing Accuracy
Measures errors during warehouse operations. Even small inefficiencies at this stage can scale into major issues at higher volumes.
Inventory & Warehouse Optimization Metrics
- Inventory Turnover Rate
Shows how often inventory is sold and replenished over a period. A higher rate indicates efficient inventory movement and strong demand. - Inventory Accuracy Rate
Compares recorded inventory with actual physical stock. Poor accuracy leads to stockouts, overselling, and order cancellations. - Dock-to-Stock Time
Tracks how quickly incoming inventory is made available for sale. Faster turnaround improves fulfillment readiness. - Stockout Rate
Indicates how often products are unavailable when customers try to purchase. High stockouts directly affect revenue and customer trust,

Cost Control & Shipping Efficiency Metrics
- Shipping Cost per Order
Calculates total shipping cost divided by the number of orders. Helps identify cost inefficiencies across zones and carriers. - Cost per Shipment by Carrier
Breaks down shipping expenses by carrier. Useful for optimizing carrier allocation and negotiating better rates. - Reverse Logistics Cost
Captures the cost involved in handling returns, including pickup, inspection, and restocking. Often underestimated but critical for margins. - Packaging Cost per Order
Tracks packaging expenses per shipment. Optimizing this can reduce both material costs and shipping weight charges.
Returns & Customer Experience Metrics
- Return Rate
Percentage of total orders returned. High return rates may indicate product issues, expectation gaps, or delivery experience problems. - Return Processing Time
Measures how quickly returned orders are processed and refunds or replacements are issued. Faster processing improves trust. - Customer Complaint Rate
Tracks the volume of delivery-related complaints. It helps identify recurring issues in shipping, handling, or communication. - Net Promoter Score (NPS) for Delivery Experience
Measures how likely customers are to recommend your brand based on delivery experience. Logistics plays a major role in shaping this perception.
Operational Visibility & Control
- Shipment Tracking Accuracy
Measures how accurate and timely your tracking updates are. Poor tracking visibility increases customer anxiety and support queries, while accurate updates improve overall experience.
Most businesses already track a few of these metrics. But the real shift happens when they start connecting them, understanding how delivery delays impact returns, how inventory gaps affect cancellations, or how carrier performance influences costs.
Because at scale, small improvements compound quickly. A slight increase in delivery success, a small reduction in returns, or better cost control can significantly impact profitability and customer loyalty.
The goal isn’t to track more. It’s to track what matters, and actually act on it.
How eShipz Simplifies eCommerce Logistics KPIs Without Overcomplicating Operations
Tracking metrics is one thing, using them effectively is where most teams struggle. As order volumes grow, dashboards become cluttered, tools become disconnected, and decision-making slows down.
High-performing ecommerce teams take a different approach. Instead of just reporting numbers, they focus on what those numbers are telling them. They look for bottlenecks, connect data across warehouse and shipping operations, and continuously optimize decisions like carrier allocation and delivery routing.
This shift is important because managing each metric in isolation rarely works. Delays in processing affect delivery timelines, poor carrier performance increases RTOs, and lack of visibility leads to reactive firefighting. What teams really need is a connected view of operations, not more reports.
That’s where platforms like eShipz come in, not as replacements for existing systems, but as a coordination layer. By bringing together carriers, warehouses, and tracking into one flow, it becomes easier to act on insights, not just track them.
From Metrics to Meaningful Decisions
Most ecommerce teams already track these numbers. The real difference comes from how consistently and intelligently they act on them. Because at scale, even small improvements compound, better delivery performance, fewer returns, and faster processing don’t just optimize operations, they directly impact revenue and customer loyalty.
Looking ahead, logistics will become less about managing shipments and more about orchestrating decisions in real time. The teams that win won’t be the ones tracking the most metrics, but the ones turning the right signals into faster, smarter actions.
To be honest, this is where many businesses start feeling the gap. Tracking exists, but clarity, control, and coordination are still missing. And that’s exactly where a more connected approach to logistics starts making a difference.
If you’re starting to see these gaps in your own operations, now might be the right time to rethink how everything comes together.
Explore how eShipz helps simplify and connect your logistics, without adding more complexity.