




Shipping costs keep rising, carriers perform differently on every lane, and the data sits in courier portals, email threads and spreadsheets. Shipping analytics platforms bring that data into one view, so you can see what each shipment really costs and which carrier delivers on time. The pressure is real: a Capgemini Research Institute study found that 97% of organizations think current last-mile delivery models cannot be sustained at scale. This guide covers what shipping analytics is, why it matters, and how 10 platforms compare on cost, carriers and delivery performance. It is written for D2C brands, e-commerce sellers, 3PLs and logistics teams.
What Is a Shipping Analytics Platform?
A shipping analytics platform is software that collects shipping data from carriers, stores and warehouses and turns it into dashboards and reports. You will also see it sold as shipping analytics software or logistics analytics. It tracks:
- Cost per order
- On-time delivery %
- First-attempt delivery rate
- RTO % (return to origin)
- Transit time by zone
A label tool prints labels. A tracking page shows where one parcel is. Shipping analytics platforms compare thousands of shipments to show which carrier, lane or pincode is costing you money.
Why Shipping Analytics Is Essential
Hidden costs. Freight bills rarely match the rate you were quoted. Weight discrepancies, fuel and remote-area surcharges, and COD fees add up, and most teams find them only when the monthly invoice lands. Cost analytics shows the real cost per order by carrier, zone and weight slab.
Carrier variance. A carrier that delivers Bengaluru to Mumbai in two days may take six days to reach certain pincodes in the northeast. Average transit time hides this. Carrier performance analytics shows it lane by lane.
Customer expectations. Late parcels create WISMO (“where is my order”) tickets, bad reviews and lost repeat orders. In the same Capgemini study, 74% of customers who were happy with delivery said they would spend more with that retailer.
Returns and RTO. A failed COD delivery often costs you freight both ways and keeps stock out of sale for days. In COD-heavy markets, RTO is one of the biggest profit leaks.
Reactive vs. proactive. Without data, teams react to complaints. With it, they spot a failing lane on Tuesday and move volume before Friday. That shift is why shipping analytics platforms are becoming standard for growing brands.
| Area | Without analytics | With analytics |
| Cost | Surprises on the monthly invoice | Cost per order tracked daily |
| Carrier choice | Habit or lowest rate | On-time and RTO data per lane |
| Delays | Found through complaints | Flagged by alerts |
| RTO | Counted at month end | Tracked by carrier, pincode and reason |
| Reporting | Spreadsheets from several portals | One dashboard |

Market Trends
Last-mile cost pressure. E-commerce growth keeps loading more parcels onto the last mile. Capgemini Research Institute reports that last-mile delivery makes up 41% of total supply chain costs, which is why a small gain per shipment matters.
Multi-carrier strategies. One courier rarely covers every pincode well, so brands now split volume across several. That only works if you have data to decide the split. eShipz explains how rules can pick a carrier per order in its guide to courier allocation software.
AI and predictive analytics. AI powered logistics tools now predict delays, recommend carriers and score RTO risk before an order ships. AI logistics analytics gets better as it sees more shipments. McKinsey reports that early adopters of AI-enabled supply chain management cut logistics costs by 15% compared with slower-moving competitors.
Real-time visibility. Shoppers expect a status update before they ask for one. Proactive WhatsApp and SMS messages are now the baseline.
Freight audit automation. Brands want invoice checks done by software, so billing errors surface within days instead of quarters.
Sustainability reporting. Carbon per shipment is still early, but larger retailers are starting to ask carriers and partners for it.
Shipping analytics platforms sit behind all of these trends. For a wider look at where parcel shipping is heading, read eShipz’s piece on the top shipping trends for ecommerce brands.
Benefits and Outcomes
Good shipping analytics platforms lead to six practical outcomes:
- Lower shipping cost. You find the cheapest carrier that still delivers well on each lane, and catch billing errors such as wrong weight slabs.
- Better on-time and first-attempt delivery. You see which carriers miss promised dates and which fail on first attempts.
- Fewer RTOs and returns. Carrier-wise and pincode-wise RTO data shows where orders go back and why.
- Smarter carrier allocation. Volume moves to carriers that earn it, using rules based on weight, value, service and location.
- Better customer experience. Fewer late parcels means fewer WISMO tickets for your support team.
- Faster decisions. One dashboard replaces logging into five carrier portals and merging exports.
The results can be large. One leading fashion retailer saw a 25% drop in RTOs after automating its shipping workflows with eShipz.
How Shipping Analytics Works
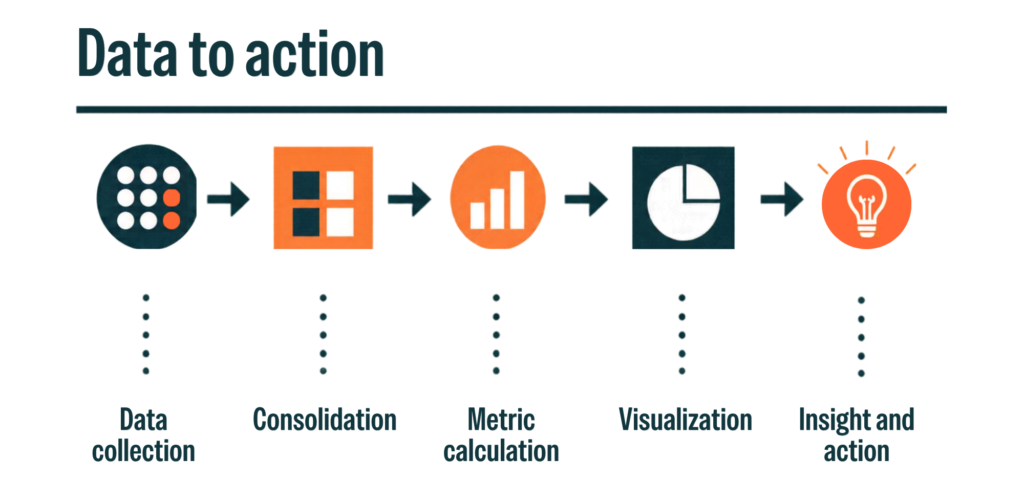
Most shipping analytics platforms follow the same five steps:
- Data collection. The platform pulls data from carrier APIs, your store, your ERP and your warehouse system.
- Consolidation. It cleans the data and matches each tracking number to an order.
- Metric calculation. It works out cost per order, on-time %, first-attempt %, RTO % and transit time.
- Visualization. Results appear in dashboards, scorecards and scheduled reports.
- Insight and action. Alerts and recommendations tell you what to change, such as moving a lane to another carrier.
Key Features to Look For
When you compare shipping analytics platforms, check for these:
- Multi-carrier integration
- Real-time tracking data
- Carrier scorecards
- Cost and freight audit
- NDR and RTO analytics
- Custom dashboards
- Integrations with Shopify, WooCommerce and ERP systems
- Ability to scale with your volume
- Transparent pricing
These nine points are also the yardstick for the comparison below.
The 10 Best Shipping Analytics Platforms
We compared each of these shipping analytics platforms on cost visibility, carrier coverage, delivery analytics, ease of use and integrations. Which one fits depends on where you ship and how much volume you move.
eShipz
A multi-carrier shipping automation platform that puts 200+ couriers on one dashboard, with carrier performance comparison, rate comparison, NDR and RTO tracking, and finance-ready reports. It suits brands that want analytics and automation together. The next section covers it in more detail.
Shiprocket
- Overview: India-focused aggregator that connects sellers to many couriers from one panel.
- Key analytics: Shipment, courier and NDR dashboards, RTO tracking, COD remittance status.
- Pros: Wide courier choice in India, low barrier to start, strong COD tools.
- Cons: Reporting suits small and mid-size sellers, and deep custom analysis is limited.
- Best for: D2C brands shipping mostly within India.
ShipStation
- Overview: Multi-carrier shipping software popular with marketplace and web store sellers.
- Key analytics: Reports on shipping spend, carrier usage and order volume, plus automation rules for carrier choice.
- Pros: Many store and marketplace integrations, mature rules engine.
- Cons: Delivery outcome analytics are lighter than cost reports, and Indian carrier coverage is limited.
- Best for: US, UK and Australia based multi-channel sellers.
Shippo
- Overview: Shipping API and dashboard that gives small brands access to several carriers.
- Key analytics: Shipments dashboard showing carrier performance and delays by lane, plus spend reports.
- Pros: Quick setup, developer friendly, simple interface.
- Cons: Analytics mostly stop at the carrier scan, so post-delivery insight needs another tool.
- Best for: Small e-commerce brands and developers building shipping into their own app.
AfterShip
- Overview: Tracking and post-purchase platform that also offers shipping and carrier recommendations.
- Key analytics: On-time analytics by carrier and lane, notification engagement, exception rates, and carrier recommendations that skip services with high exception rates.
- Pros: Deep delivery analytics, branded tracking and notifications.
- Cons: Advanced analytics sit on higher plans, and cost analysis is lighter than delivery analysis.
- Best for: Brands focused on post-purchase experience.
Delhivery
- Overview: One of India’s largest logistics companies, with its own network and a seller dashboard.
- Key analytics: Delivery status, NDR and RTO reports for shipments moved on its own network.
- Pros: Direct control of its network and wide pincode reach.
- Cons: Data covers one carrier, so you cannot benchmark against others.
- Best for: Brands that rely on one primary carrier.
project44
- Overview: Enterprise visibility platform covering parcel, truckload and ocean freight.
- Key analytics: Predictive ETAs, carrier performance scorecards, exception alerts.
- Pros: Broad mode coverage, large carrier network, strong enterprise integrations.
- Cons: Pricing and setup suit large shippers more than small parcel sellers.
- Best for: Enterprises shipping across several freight modes.
FarEye
- Overview: Delivery orchestration platform for enterprises and logistics providers.
- Key analytics: Predictive delivery times, carrier management, last-mile performance dashboards.
- Pros: Handles complex networks and includes AI powered shipping analytics such as delay prediction.
- Cons: Implementation takes time, and it offers more than small sellers need.
- Best for: Large retailers and 3PLs with complex last-mile networks.
Parcel Perform
- Overview: Delivery experience platform that tracks parcels across many carriers worldwide.
- Key analytics: Carrier benchmarking, delivery predictions, delay and exception reporting.
- Pros: Wide international carrier coverage and strong benchmarking.
- Cons: Focused on tracking and delivery data, so labels and rate shopping need another tool.
- Best for: Cross-border brands using many carriers.
Sendcloud
- Overview: European shipping platform with labels, returns and branded tracking.
- Key analytics: Reports on costs, carriers and delivery times.
- Pros: Strong European carrier coverage and easy store integrations.
- Cons: Europe-first coverage makes it a weaker fit for India-based shipping.
- Best for: European D2C brands.
| Platform | Best For | Carrier Coverage | Cost Analytics | Delivery Analytics | Pricing |
| eShipz | Multi-carrier shippers in India and abroad | 200+ couriers | Rate comparison, cost reports | Carrier TAT, success rate, NDR, RTO | Demo / quote |
| Shiprocket | Indian D2C sellers | Many Indian couriers | Shipment and COD reports | NDR and RTO dashboards | Plan based |
| ShipStation | Multi-channel sellers in US, UK, AU | Major Western carriers | Spend and carrier usage | Basic | Tiered by volume |
| Shippo | Small brands, developers | Several global carriers | Spend reports | Carrier performance by lane | Plan and pay-as-you-go |
| AfterShip | Post-purchase focus | Large carrier library | Limited | On-time by carrier and lane | Tiered, advanced on higher plans |
| Delhivery | Single-carrier brands | Own network | Own shipments only | Own shipments only | Rate card |
| project44 | Large multi-mode shippers | Large global network | Limited | Predictive ETAs, scorecards | Custom quote |
| FarEye | Enterprises, 3PLs | Broad integrations | Limited | Predictive delivery, last-mile | Custom quote |
| Parcel Perform | Cross-border brands | Wide international | Limited | Benchmarking, predictions | Custom quote |
| Sendcloud | European D2C | Strong in Europe | Cost reports | Delivery time reports | Plan based |
How eShipz Does It
eShipz (https://www.eshipz.com/) is a multi-carrier shipping automation platform that puts courier partners on one dashboard. It has crossed 100 million shipments, so its analytics sit on real volume across domestic and international lanes.
Among shipping analytics platforms, eShipz covers the full path from booking to delivery:
- Single dashboard for shipments, costs and statuses
- Carrier performance comparison on TAT, success rate and delays
- Rate comparison and automated allocation rules based on weight, value, service mode and pincode
- NDR management and RTO tracking with reasons by carrier
- Real-time tracking and automated customer notifications
- Reports for finance and ops teams
The allocation logic is described in its post on how courier allocation picks the best carrier.
The outcome is lower freight cost, fewer failed deliveries and faster carrier decisions. One leading fashion retailer cut RTOs by 25% after automating its shipping workflows.
See how eShipz can simplify your shipping analytics. Book a demo.
Where Can You Start?
- Audit your current shipping data. Collect the last 90 days of invoices, tracking exports and RTO lists.
- Define 4 or 5 KPIs. Good starting set: cost per shipment, on-time %, first-attempt %, RTO % and NDR resolution rate.
- Centralize carriers on one platform. Stop checking each courier portal separately.
- Set up dashboards and alerts. Alert on a lane when on-time % or RTO % crosses your limit.
- Review weekly or monthly. Move volume toward carriers that perform better.
- Pilot on one lane first. Pick a high-volume lane, prove the gain, then scale.
How to Choose the Right Platform
Use this checklist: shipment volume, carriers you need, store and ERP integrations, budget and support quality. Ask for a demo with your own data, then run a 30-day pilot before you commit. Check that the platform can scale with your order volume and covers the local carriers you actually use. A tool that is strong in Europe but weak in India will not help an Indian D2C brand, and the reverse is also true.
Conclusion
Shipping analytics platforms turn shipping from a cost center into an advantage. They show what each shipment costs, which carriers deliver on time, and where RTO is eating margin. Start with a few KPIs, one lane and one dashboard, then expand. Explore eShipz or book a demo.
FAQs
- What is shipping analytics?
Shipping analytics is the practice of collecting shipment data and turning it into reports on cost, carrier performance and delivery outcomes, so you can make decisions with facts.
- Which metrics matter most?
Start with cost per shipment, on-time delivery %, first-attempt delivery rate, RTO % and NDR resolution rate. Add transit time by zone once those are stable.
- How does it reduce shipping costs?
It shows the real cost per order by carrier and lane, flags billing errors such as weight discrepancies, and helps you shift volume to the best carrier for each route.
- Can it reduce RTO?
Yes. Carrier-wise and pincode-wise RTO data shows where orders fail. Pair it with fast NDR follow-up and better carrier allocation to bring RTO down.
- What is the difference between shipping analytics and shipment tracking?
Tracking tells you where one parcel is. Shipping analytics platforms compare thousands of shipments to show patterns in cost, delays and returns.
- Do small businesses need shipping analytics platforms?
If you ship through two or more carriers or see regular RTOs, yes. Even a few hundred orders a month hide cost and delivery patterns that a dashboard reveals.
- How does AI improve shipping analytics?
AI can predict delays, recommend the best carrier for an order and score the RTO risk of a shipment, so you act before problems reach the customer.