







India spent 7.97% of its GDP on logistics in 2023-24, or about ₹24.01 lakh crore, according to the DPIIT-NCAER logistics cost assessment released by the Government of India. The same document notes that on a trip of about 600 km, improving the first and last 50 kilometers can significantly lower total logistics cost.
For an online seller, that final stretch shows up as your last mile delivery cost: the amount you pay to move a parcel from the final carrier hub to your customer’s door. It almost never stays at the number printed on the rate card.
Failed attempts, cash on delivery (COD) handling, return legs and weight disputes quietly add layers on top. This guide shows how to calculate your real last mile delivery cost, where it leaks, and how to bring it down in six practical steps.
All numbers in the worked examples are illustrative, so replace them with your own data. If you want a platform view of carrier allocation and tracking while you read, see eShipz.
What Is Last Mile Delivery Cost?
Last mile delivery cost is the total expense of the final leg of a shipment, from the destination hub or delivery station to the customer’s address. It covers the courier’s delivery charge and every extra charge or loss that the final leg creates.
Most sellers only look at the freight line on the invoice. That figure is the starting point of your last mile delivery cost, not the end of it.
What Counts in Last Mile Delivery Cost
- Base delivery charge: the per-parcel rate for the zone and weight slab.
- Reattempt charges: extra fees or lost time when the first delivery fails.
- Return-to-origin (RTO) costs: the reverse leg for parcels that never reach the customer.
- COD fees: handling charges and the cost of waiting for remittance.
- Weight and dimension adjustments: charges added after the carrier re-measures the parcel.
- Customer support: staff time spent answering where-is-my-order queries.
Last Mile Delivery Cost vs. Shipping Rate
A shipping rate is the price quoted for moving a parcel from origin to destination. Last mile delivery cost is the outcome after real-world events change that price.
Two sellers can pay the same rate card and end up with very different costs. The one with fewer failed deliveries and cleaner data pays less per delivered order.
Why Last Mile Delivery Cost Runs Higher Than Expected
The final leg is the least predictable part of a shipment. Each delivery is a separate stop with its own address, access issues and customer availability.
The table below lists the main drivers and what to track for each one. Start with the drivers that touch the most orders.
| Cost driver | Why it adds to last mile delivery cost | What to track |
|---|---|---|
| Failed first attempts | Every reattempt consumes another stop, more fuel and rider time, and often another fee. | First-attempt delivery rate by pincode and carrier |
| Poor address quality | Incomplete addresses and wrong pincodes lead to wasted trips and returns. | Share of orders with address corrections after dispatch |
| COD orders | Cash collection adds handling steps, delayed remittance and higher refusal risk. | COD share, COD refusal rate, remittance days |
| Low delivery density | Sparse routes mean fewer drops per trip, so each parcel carries more of the trip cost. | Drops per route by zone |
| Weight mismatches | Declared weight differing from carrier-measured weight triggers surcharges. | Weight discrepancy rate and value |
| Carrier mismatch | Sending every order to one carrier ignores pincode-level strengths and weaknesses. | Cost and delivery rate per carrier per zone |
| Returns and RTO | The reverse leg is paid in full and the parcel earns no revenue. | RTO rate and RTO cost per order |
Notice that most drivers are controllable. Address quality, carrier choice and weight accuracy sit inside your own workflow.
How to Calculate Last Mile Delivery Cost Per Order
The core formula is simple. Add every cost the final leg creates in a month, then divide by the number of orders actually delivered.
Dividing by delivered orders, not shipped orders, matters. A parcel that returns to origin still cost money but produced no sale.
A Worked Example With Illustrative Numbers
Assume a seller ships 10,000 orders a month. Every figure below is hypothetical and exists only to show the method.
| Cost component | Illustrative assumption | Monthly cost (₹) |
|---|---|---|
| Base delivery charges | 10,000 orders × ₹55 average rate | 5,50,000 |
| Reattempt charges | 12% of orders need a second attempt × ₹30 | 36,000 |
| RTO charges | 8% of orders return × ₹55 reverse charge | 44,000 |
| COD fees | 4,000 COD orders × ₹20 handling fee | 80,000 |
| Weight adjustments | 3% of orders adjusted × ₹20 | 6,000 |
| Support cost | 15% of orders raise a tracking query × ₹8 | 12,000 |
| Total | Sum of the rows above | 7,28,000 |
Divide ₹7,28,000 by 10,000 orders and the effective figure is ₹72.80 per order. The rate card said ₹55, so about ₹17.80 per order, or roughly a quarter, comes from layers the seller never budgeted.
To keep this example honest, note what it ignores: fuel surcharges, GST treatment and any negotiated discounts. Add those if they apply to your contracts.
Where the Money Leaks
The chart shows the same illustrative example as cost per order. The base rate is the largest bar, but COD fees and RTO charges are the next biggest.
This pattern is typical in shape, even though your numbers will differ. The base rate is negotiated once, while the leaks recur every month.
What a Small Improvement Is Worth
Now test a modest change on the same hypothetical seller. Suppose better address checks and COD confirmation lower reattempts from 12% to 8% of orders, and RTO from 8% to 6%.
| Line item | Before (₹ per month) | After (₹ per month) | Saving (₹ per month) |
|---|---|---|---|
| Reattempt charges | 36,000 | 24,000 | 12,000 |
| RTO charges | 44,000 | 33,000 | 11,000 |
| All other lines | 6,48,000 | 6,48,000 | 0 |
| Total | 7,28,000 | 7,05,000 | 23,000 |
The seller saves ₹23,000 a month, or ₹2,76,000 a year, and the cost per order falls from ₹72.80 to ₹70.50. These are still illustrative figures, but they show why operational fixes deserve the same attention as rate negotiations.
The savings also understate the benefit, because fewer failures mean fewer unhappy customers and fewer cancelled orders. Those effects are real but hard to price, so the table leaves them out.
How Geography and Peak Periods Change Your Costs
Cost per delivery is not flat across the country. Dense metro routes let a rider drop many parcels per trip, while a scattered tier 2 or tier 3 route spreads the same trip cost over fewer parcels.
That is why a single blended average can mislead you. Split your data by zone before you decide that a carrier is expensive or cheap.
Peak periods add another layer. During festive sales, carriers handle more volume with the same riders, and address errors and missed attempts tend to rise with the rush.
Plan for this by checking carrier performance before the season, keeping a backup carrier ready for your highest-volume pincodes, and tightening address checks when order volume jumps. Ask each carrier how it handles surge volume and what it expects from you on packaging and labeling.
A seller who prepares before the rush avoids paying for emergency fixes during it. A short preparation list is cheaper than a week of escalations.
Step-by-Step Plan to Reduce Last Mile Delivery Cost
Reducing last mile delivery cost is a sequence, not a single trick. Each step below feeds the next, and the infographic shows the full loop.
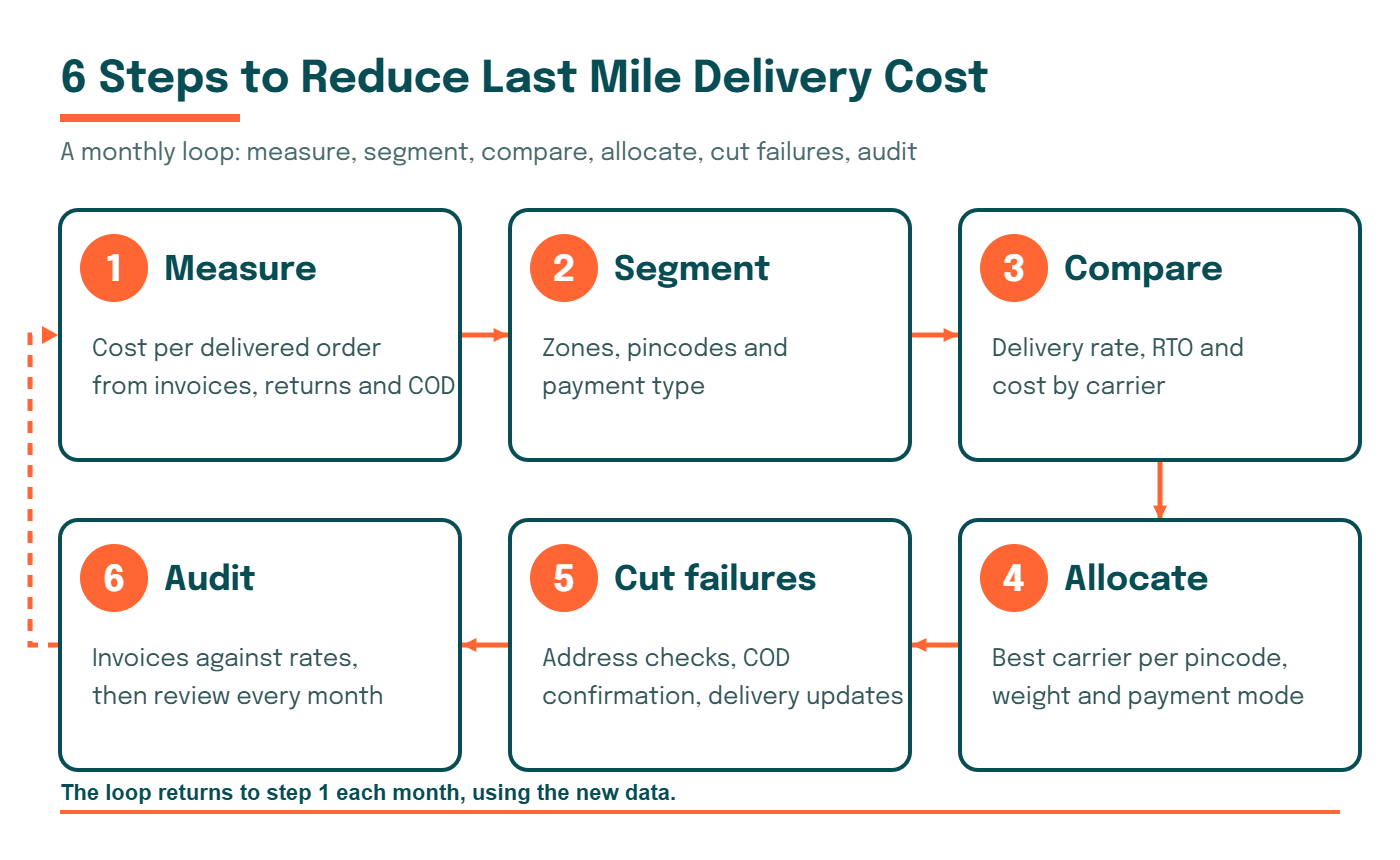
Step 1: Measure Your True Cost Per Order
Use the formula above for the last three months. Pull invoice data, return data and COD data into one sheet so nothing hides in a different report.
Three months smooths out one-off spikes. If you have a recent sale or a carrier outage in that window, note it so you do not mistake it for a trend.
Step 2: Segment by Zone and Pincode
Average cost hides the problem areas. Group orders by zone, pincode cluster and payment type to see which segments lose money.
You will usually find that a small number of pincodes create a large share of failures. Those pincodes are where a different carrier or a stricter confirmation process pays back first.
Step 3: Compare Carrier Performance
Rank carriers on delivery rate, first-attempt success, RTO and cost for each segment. A carrier that is cheapest on paper can be the most expensive after failures.
Step 4: Allocate Orders by Cost and Performance
Assign each order to the carrier that wins for its pincode, weight and payment mode. Review the rules monthly, because carrier performance changes with seasons and staffing.
Your cost model also strengthens your hand in rate talks. When you can show a carrier its own delivery rate and RTO rate by zone, the conversation moves from price alone to price and performance together.
Step 5: Cut Failed Deliveries
Failed attempts are the biggest recurring leak. Validate addresses before dispatch, confirm COD orders, and trigger timely delivery updates. Our guide to first attempt delivery rate explains how to measure and improve the metric that drives this step.
Step 6: Audit Invoices and Review Monthly
Match carrier invoices against contracted rates and recorded weights. Dispute overcharges within the carrier’s claim window, then feed the findings back into step one.
Delivery Models Compared by Last Mile Delivery Cost Control
Different delivery models give you different levers. The table compares them on control, coverage and effort, without assuming any specific rate.
| Model | Cost control | Coverage | Operational effort | Best suited for |
|---|---|---|---|---|
| Single courier | Low; you accept one carrier’s pricing and weaknesses | Limited to that carrier’s network | Low | Very small sellers with few pincodes |
| Multi-carrier shipping | High; carriers compete per pincode and weight | Wide, since you can mix networks | Medium without software, low with it | Growing sellers with national reach |
| In-house fleet | High within the covered area, fixed costs elsewhere | Narrow, usually one city | High | Dense local delivery |
| Hyperlocal or crowdsourced riders | Variable; depends on surge and availability | City-level | Medium | Same-day delivery in metros |
For most online sellers, multi-carrier shipping gives the best balance. It lets you shift volume when a carrier’s performance drops, without rebuilding your operation.
Last Mile Delivery Cost Prevention Checklist
Use this checklist before each dispatch cycle. Each item targets a specific line in your cost model.
- Validate address and pincode at checkout before the order reaches the warehouse.
- Capture correct weight and dimensions, and photograph the packed parcel for disputes.
- Confirm high-risk COD orders by call or message before dispatch.
- Allocate carriers by pincode performance instead of a fixed default.
- Send delivery updates so customers are available for the attempt.
- Reconcile COD remittances against delivered orders every week.
- Audit carrier invoices against contracted rates every month.
- Review the worst ten pincodes and change carrier rules for them.
Common Mistakes That Inflate Last Mile Delivery Cost
These patterns show up again and again in shipping operations. Each one is easy to fix once you can see it.
- Judging carriers by rate card alone, which ignores failed deliveries and returns.
- Using one carrier everywhere, even for pincodes where it performs poorly.
- Leaving COD at the default setting for every order and every customer.
- Skipping weight checks, then absorbing surcharges without disputing them.
- Reviewing costs quarterly, when a bad lane can drain margin within weeks.
- Treating RTO as a customer problem instead of a process problem.
A useful rule: if a cost repeats every month and nobody owns it, it is a leak. Assign one person to each line of the cost model.
Another common mistake is fixing symptoms. Sellers chase a carrier for a missed delivery but never ask why the address was wrong or why the customer was unreachable. Trace each failure back to its cause and fix the cause once, rather than paying for the same failure repeatedly.
Finally, many teams keep cost data in separate tools. Freight invoices sit in finance, return data sits in the warehouse system and COD data sits with the payment partner. Until those three views meet in one report, nobody sees the full number.
Questions to Ask Carriers About Their Final Leg
Numbers from your own data tell you where to look. Carriers can tell you why, if you ask specific questions instead of general ones.
- How many delivery attempts do you make before marking a parcel undelivered, and how are they spaced?
- How do you handle address clarification, and can your riders call the customer before the first attempt?
- What is your policy for re-measuring weight, and what proof do you share when you adjust it?
- How quickly do you remit COD collections, and how do you report refusals?
- What is the claim window for damaged or lost parcels, and what documents do you need?
Write the answers down next to each carrier’s performance data. When the stated policy and the observed results disagree, you have found a conversation worth having.
Keep the tone practical. Carriers respond better to a specific list of pincodes and dates than to a general complaint about service.
KPIs to Track Last Mile Delivery Cost
A few metrics tell you whether your last mile delivery cost is improving. Track them weekly and compare by carrier and zone.
| KPI | Formula | What it tells you |
|---|---|---|
| Cost per delivered order | Total last mile cost ÷ delivered orders | Your true unit cost |
| First-attempt delivery rate | Orders delivered on attempt one ÷ orders shipped | How many parcels avoid reattempt charges |
| RTO rate | Returned-to-origin orders ÷ orders shipped | How much revenue-free freight you pay for |
| COD refusal rate | Refused COD orders ÷ COD orders shipped | Risk concentrated in cash orders |
| Weight discrepancy rate | Orders with weight adjustment ÷ orders shipped | Accuracy of your declared weights |
| WISMO contact rate | Tracking queries ÷ orders shipped | How well you communicate delivery status |
Set a target for each metric and review it in a short weekly meeting. Small gains compound, because each percentage point removed from failures lowers cost on every future order.
How eShipz Helps Control Last Mile Delivery Cost
eShipz is a shipping automation platform that connects sellers with multiple carriers. The features below map to the steps in this guide; please confirm current availability with the eShipz team.
- Carrier allocation: CarrierSmart AI selects a courier for each order by balancing speed, cost and performance, which supports step four.
- Tracking: Track360 provides real-time tracking and delay alerts, which supports step five and reduces tracking queries.
- Redelivery: ReDelivR identifies failure reasons and triggers smart retries to prevent RTO.
- Freight audit: FreightGuard AI checks carrier invoices against contracted rates and flags overcharges, which supports step six.
Together these tools give you one view of cost and delivery performance across carriers. You can explore the full platform on the eShipz website.
Conclusion: Make Last Mile Delivery Cost a Monthly Habit
Last mile delivery cost is the sum of the rate card and everything that goes wrong after dispatch. The rate card is visible, but the leaks are where most of the savings sit.
Start by calculating your true cost per delivered order, then work through the six steps: measure, segment, compare, allocate, cut failures and audit. Review the results every month and your last mile delivery cost will become a number you manage instead of a number you discover.
Last Mile Delivery Cost FAQs
What is last mile delivery cost?
Last mile delivery cost is the total expense of the final leg from the carrier’s destination hub to the customer’s door. It includes the base delivery charge plus reattempts, returns, COD fees, weight adjustments and support effort.
How do you calculate last mile delivery cost per order?
Add all final-leg costs for the month and divide by delivered orders. Using delivered orders instead of shipped orders makes returned parcels raise the figure, which reflects reality.
Why is last mile delivery cost so high?
Each delivery is a separate stop with its own address and customer availability. Failed attempts, sparse routes and return legs add expense that the rate card does not show.
How can I reduce last mile delivery cost without changing carriers?
Improve address quality, confirm COD orders, send delivery updates and fix declared weights. These changes cut reattempts, RTO and surcharges while your contracts stay the same.
Does COD increase last mile delivery cost?
Usually yes. COD adds handling fees, delays your cash and raises the risk of refusal at the door. Confirming COD orders before dispatch reduces that risk.
Is multi-carrier shipping cheaper than using one courier?
It often helps because carriers perform differently by pincode and weight. Sending each order to the best-fit carrier can lower failures and cost, though results depend on your order mix.
How often should I review my last mile delivery cost?
Review it monthly at a minimum, and check key KPIs weekly. Carrier performance changes with seasons, so quarterly reviews can miss costly problems.