







Every parcel gets one best chance to arrive: the first attempt. When it works, the customer is happy and you pay for one trip. When it fails, you start paying again.
The Capgemini Research Institute’s The Last-Mile Delivery Challenge describes last-mile delivery as the most expensive part of the supply chain. The same report found that close to three-fourths of consumers are willing to reward retailers that get the last-mile experience right, with more spend and more loyalty.
That makes your first attempt delivery rate one of the most revealing numbers in your operation. It shows, in a single figure, whether your address data, courier choice, customer communication and delivery promises worked together on the first try.
In this guide to first attempt delivery rate, you will learn what it means, how to calculate it, why first attempts fail, what a failed attempt costs, a six-step plan to raise it, and the KPIs worth watching. Every cost figure in this post is an illustrative model, not a benchmark.
What is first attempt delivery rate?
First attempt delivery rate is the share of shipments that are delivered successfully on the courier’s first delivery attempt. If a rider reaches the customer, hands over the parcel and closes the shipment on attempt one, it counts. If the shipment needs a second visit, an address correction or a return, it does not.
Teams often shorten it to FADR. A high first attempt delivery rate means fewer Non-Delivery Reports (NDRs), fewer customer calls and fewer parcels travelling back to your warehouse.
It is different from the overall delivery rate. A brand can show a 95% overall delivery rate and still have a weak first attempt delivery rate, because the final number hides how many parcels needed two or three visits to get there.
That gap is where money leaks. Those extra visits are billed, delayed and noticed by customers, even though the parcel eventually arrives.
How to calculate first attempt delivery rate
The formula is simple. Divide the shipments delivered on the first attempt by the total shipments that reached the out-for-delivery stage, then multiply by 100.
Define your denominator before you start. Mixing dispatched shipments with attempted shipments will make your FADR look better or worse than it is, and the trend will mislead you.
Here is a worked example with hypothetical numbers. A brand ships 2,000 orders in a week, and 1,700 of them are delivered on the first attempt. The calculation is 1,700 ÷ 2,000 = 85%.
Now split the same week by payment mode. Suppose prepaid orders show 92% and COD orders show 78% (both hypothetical). The blended figure hides a COD problem that a simple average would never reveal.
| Version | Formula | Best used for |
|---|---|---|
| Standard FADR | Delivered on attempt 1 ÷ shipments attempted | Courier and lane comparison |
| Dispatch-based FADR | Delivered on attempt 1 ÷ shipments dispatched | Whole-network health |
| Payment-mode FADR | FADR split by COD and prepaid | Spotting COD risk |
| Pincode FADR | FADR split by delivery pincode | Finding weak serviceability zones |
Pick one version as your headline number and keep the others as diagnostic cuts. Report the first attempt delivery rate weekly, because a monthly average will hide a bad courier week.
Why first attempts fail
Most failed first attempts are not courier mysteries. They trace back to a short list of causes, and many of them are visible before the parcel leaves your warehouse.
| Cause | What happens | Who can fix it |
|---|---|---|
| Incomplete or wrong address | Rider cannot find the location | Brand, before dispatch |
| Customer not available | No one is home or reachable | Brand and customer |
| Phone unreachable or wrong | Rider cannot call to confirm | Brand, at checkout |
| COD refusal or no cash ready | Customer declines at the door | Brand, through order confirmation |
| Out-of-area or poor serviceability | Courier does not cover the pincode well | Brand, through carrier choice |
| Rider capacity or route issues | Parcel is not attempted that day | Courier, tracked by brand |
| Customer changed their mind | Order is refused | Brand, through confirmation |
Notice how many rows say “brand, before dispatch.” A better FADR is mostly a data-quality and communication problem, and those sit on your side of the handover.
The remaining causes sit with the courier. You cannot fix a rider’s route, but you can measure it and shift volume away from carriers that keep missing attempts in a given lane.
What a failed first attempt really costs
A failed first attempt creates a chain of costs. First comes the re-attempt, which the courier may charge for or which uses up capacity you already paid for. Then comes customer service time, which grows with every “where is my order” call.
Then comes the worst outcome: the parcel returns to origin. You pay forward freight, return freight and handling, and you lose the sale unless you resell the item.
To see the scale, use a simple illustrative model with the assumptions below. These are hypothetical numbers for planning, not industry benchmarks, so replace them with your own rate card and RTO data.
- Volume: 1,000 orders.
- Re-attempt cost: ₹35 per failed first attempt (hypothetical).
- RTO share: 25% of failed first attempts end as returns, each adding ₹70 in return freight (hypothetical).
- Extra cost per failed first attempt: ₹35 + (25% × ₹70) = ₹52.50.
At a 70% FADR, those 1,000 orders carry about ₹15,750 in extra cost. At 95%, the same volume carries about ₹2,625. The gap is the prize for fixing the process, and it grows with your volume.
The model leaves out lost sales, customer goodwill and support time, so the real cost of a weak first attempt delivery rate is higher than the chart shows.
A six-step plan to improve first attempt delivery rate
You do not need a new system to start. You need a clear sequence, one owner per step, and a weekly review. The six steps below move from prevention to recovery.
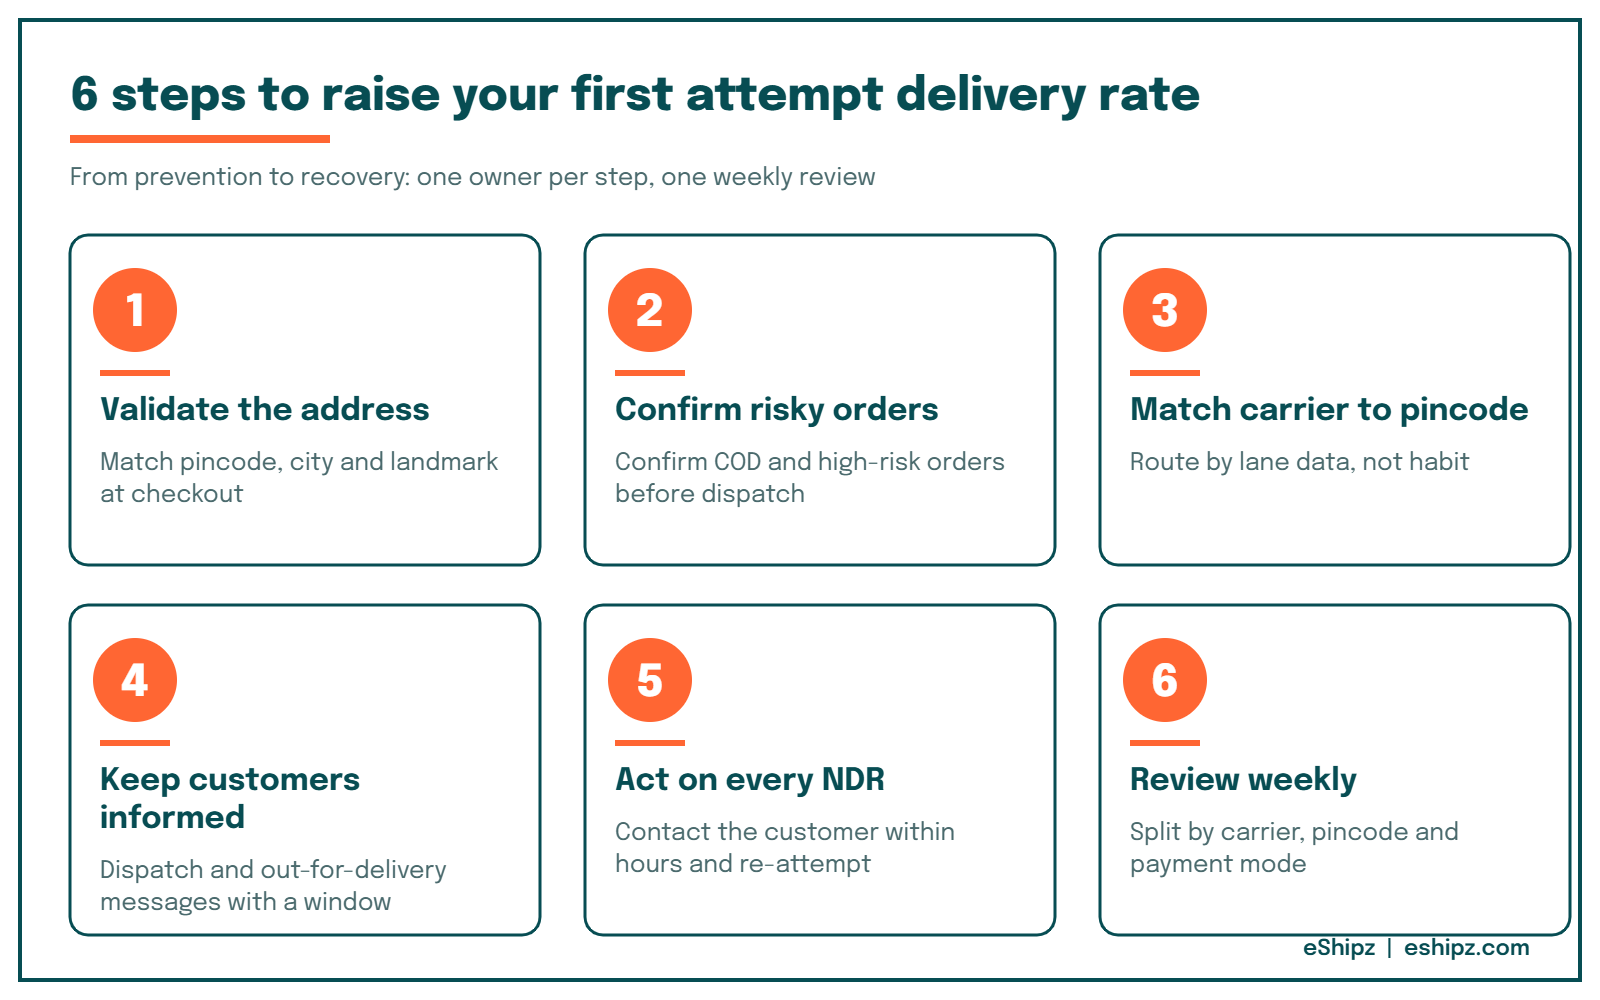
Step 1: Validate the address at checkout
Most failures start with an address that looked fine on screen but fails on the street. Check that the pincode matches the city, the address has a landmark or house number, and the phone number has the right length.
Flag risky addresses for a quick fix before the label prints. Fixing an address costs seconds at checkout and rupees after dispatch. Our guide on shipping address validation shows how this step works in practice.
Step 2: Confirm risky orders before dispatch
Send a confirmation message for COD orders and for any order flagged as high risk. Ask the customer to confirm the address, the phone number and their intent to receive the parcel.
An order that the customer cancels before dispatch costs nothing in freight. An order refused at the door costs you the full round trip, so a confirmation step protects your FADR directly.
Step 3: Match the carrier to the pincode
Not every courier performs equally in every lane. Compare carriers by pincode and payment mode using your own first attempt delivery rate data, then route each order to the carrier most likely to deliver it on the first visit.
Review the split every week. Carrier performance shifts with season, rider capacity and local conditions, so a fixed allocation rule goes stale.
Step 4: Keep the customer informed
Send a dispatch message, an out-for-delivery message and a clear delivery window where the carrier supports one. A customer who knows the parcel is arriving today is far more likely to be reachable.
Give the customer a simple way to reply with a better time or a corrected address. This turns a likely failed attempt into a planned one.
Step 5: Act on every NDR within hours
When an attempt fails anyway, the next few hours decide whether the parcel is delivered or returned. Contact the customer, capture a clear instruction, pass it to the courier and track the re-attempt.
Use a standard reason code list so that “customer not available” and “address incomplete” trigger different actions. For a full recovery workflow, read our NDR management in India playbook.
Step 6: Review the numbers every week
Look at FADR by carrier, pincode, payment mode and failure reason. Pick the worst cut, change one thing, and check again next week.
Small weekly corrections beat large quarterly projects, because they keep your FADR moving in the right direction without waiting for a big rollout.
A simple weekly review takes under an hour. Export last week’s shipments, split them by carrier and pincode, and list the five weakest combinations. Assign one fix to each, such as a corrected address rule, a carrier switch or a new confirmation message.
Write down the change and the date. When you review the numbers next week, you will know which action moved the result and which did not, and that history becomes a playbook your whole team can reuse.
COD versus prepaid: why the split matters
Cash on delivery changes the delivery moment. The rider must find the customer, the customer must be ready to pay, and the amount must match. Each of those conditions is another way for a visit to fail.
Prepaid orders usually remove the payment step, so failures tend to come from addresses and availability instead. Reading the two groups separately tells you whether to invest in order confirmation, address checks or customer messaging first.
If your COD share is high, treat confirmation as a core step rather than an optional extra. If most orders are prepaid, put the early effort into address quality and delivery windows.
Which levers improve first attempt delivery rate the most?
Not every lever deserves equal effort. The table below compares the main levers by effort and by where they act in the delivery journey. The ratings are qualitative judgments for planning, so adjust them for your own catalog and customer mix.
| Lever | Acts at | Effort | Typical effect on FADR |
|---|---|---|---|
| Address validation | Checkout | Low | High for address-related failures |
| Order confirmation for COD | Pre-dispatch | Low | High for refusals |
| Pincode-level carrier allocation | Dispatch | Medium | High where carriers differ widely |
| Proactive delivery messages | In transit | Low | Medium |
| Fast NDR outreach | After a failed attempt | Medium | Medium to high |
| Weekly performance review | Ongoing | Low | Sustains gains |
Start with the low-effort levers. Address checks and COD confirmation usually deliver the fastest gains in first attempt delivery rate, and they cost little to run.
Move on to carrier allocation once you have enough clean data to compare couriers fairly by lane.
First attempt delivery rate checklist
Use this checklist before you scale volume or enter a new region. Each item protects your FADR.
- Pincode and city match on every order.
- Phone number is valid and reachable.
- COD orders are confirmed before dispatch.
- High-risk pincodes are flagged and routed with care.
- Carrier choice is based on recent lane data, not habit.
- Customers receive dispatch and out-for-delivery messages.
- NDR reasons are coded and acted on within hours.
- First attempt delivery rate is reviewed weekly by carrier and pincode.
If you cannot tick at least six of these, fix those gaps before you spend on anything more complex.
Common mistakes that hold the rate down
The same errors appear in many shipping operations. Most are easy to fix once someone owns the number.
Measuring only the final delivery rate. The final figure hides repeat attempts. Track the FADR separately so you can see the real cost of extra visits.
Treating every courier the same. A carrier that is excellent in one metro can be weak in a small town. Compare lanes, not just carriers.
Skipping confirmation on COD orders. COD adds a payment moment at the door, which adds a reason to refuse. A short confirmation step removes many of those refusals.
Waiting a day to call the customer. An NDR that sits overnight loses momentum. The faster you reach the customer, the better the odds of a successful second attempt.
Ignoring the reason codes. If every failure is logged as “other,” you cannot fix anything. Clean reason codes make the weekly review useful.
Ignoring peak-season pressure. During sales and festival periods, rider capacity tightens and parcels pile up at hubs. Plan for it by cleaning addresses earlier, confirming orders sooner and watching your first attempt delivery rate daily instead of weekly until volume settles.
Setting targets without context. A target copied from another brand may not fit your catalog, COD share or regions. Build your goal from your own baseline, then raise it in small steps so each gain can be traced to a specific change.
KPIs to track alongside first attempt delivery rate
The FADR tells you the outcome. The supporting KPIs tell you why it moved, so track them together on one weekly view.
| KPI | What it tells you | How to read it |
|---|---|---|
| First attempt delivery rate | Share delivered on attempt one | Higher is better; track by carrier and pincode |
| NDR rate | Share of shipments with a failed attempt | Lower is better |
| NDR resolution rate | Share of NDRs that end in delivery | Higher is better |
| RTO rate | Share of shipments returned to origin | Lower is better |
| Average delivery attempts | Visits needed per delivered parcel | Closer to one is better |
| Time to first NDR action | Hours between failure and outreach | Shorter is better |
Set targets from your own history rather than copying a number from another brand. Your product mix, COD share and regions change what a good first attempt delivery rate looks like.
How eShipz helps improve first attempt delivery rate
eShipz brings the levers above into one shipping platform, so your team does not have to stitch them together by hand. Please confirm current feature availability with the eShipz team, as modules and plans change.
According to the eShipz website, the platform includes ReDelivR for NDR management, which uses AI to identify why deliveries fail and starts automated re-attempts. It also lists CarrierSmart AI, which scores couriers on speed, cost and performance for each order.
For visibility, the site describes Track360, a single dashboard for live tracking and delay warnings, and PredictShip ETA, which uses past data to estimate delivery dates. A data and analytics module covers carrier monitoring and real-time KPI tracking.
Together, these tools cover the allocation, tracking, NDR and review steps in the plan above. Pair them with clean address data and COD confirmation, and your FADR has the support it needs to climb.
To see how this could work for your shipments, explore the eShipz shipping platform and match each feature to the step it supports.
Conclusion
A strong first attempt delivery rate is not luck. It comes from clean addresses, confirmed orders, carriers matched to lanes, informed customers and fast NDR action, all reviewed weekly.
Start by measuring your FADR by carrier and pincode, because you cannot improve a number you have not split. Fix the cheapest gaps first, then work through carrier allocation and automation.
Each point you add removes failed visits, returns and support calls, and it makes the delivery experience more reliable for your customers. If you want a platform to run these steps in one place, see how eShipz can help.
Frequently asked questions about first attempt delivery rate
1. What is a good first attempt delivery rate?
There is no single correct figure, because it depends on your regions, product mix and COD share. Set a baseline from your last 8 to 12 weeks, then aim to improve it steadily by carrier and pincode.
2. How is first attempt delivery rate different from delivery success rate?
Delivery success rate counts every parcel that eventually arrives, including those that needed several visits. FADR counts only parcels delivered on the first visit, so it shows the cost of repeat attempts.
3. Why is my first attempt delivery rate low for COD orders?
COD orders add a payment moment at the door, so customers can refuse, lack cash or change their mind. A confirmation message before dispatch usually reduces these refusals.
4. Does address validation really improve first attempt delivery rate?
Yes, because incomplete or mismatched addresses are a leading preventable cause of failed attempts. Checking the pincode, city and landmark at checkout removes many failures before the parcel ships.
5. How often should I review first attempt delivery rate?
Review it weekly, split by carrier, pincode, payment mode and failure reason. A monthly average can hide a bad week or a weak lane.
6. Can the carrier alone fix a poor first attempt delivery rate?
Rarely. Carriers control routes and rider capacity, but addresses, phone numbers, COD confirmation and customer messaging sit with the brand. The best results come from both sides working on it.
7. What should I do when a first attempt fails?
Act within hours: contact the customer, confirm the address and time, pass a clear instruction to the courier and track the re-attempt. A fast response gives the parcel its best chance of being delivered rather than returned.