









India’s online shopper base has doubled in five years to 290 to 300 million people, and e-retail reached $65 to $66 billion in gross merchandise value in 2025, according to the Bain & Company and Flipkart report How India Shops Online 2026. Bain expects growth of more than 20% a year, taking the market to $170 to $180 billion by 2030. Every one of those orders has to travel with a courier, and most brands still choose that courier by habit or by the lowest rate card.
A courier performance scorecard fixes that. It turns scattered delivery data into one weekly view that tells you which carrier to trust, which to cap and which to drop. This guide shows you how to build a courier performance scorecard, which metrics to put on it, how to weight them and how to act on the result.
What Is a Courier Performance Scorecard?
A courier performance scorecard is a single table that rates every carrier you use on the same measures, over the same period, using your own shipment data. Each carrier gets a score for delivery speed, reliability, exceptions and cost. The scores roll up into one number you can compare across carriers, zones and months.
The point is not reporting. The point is a decision. A good courier performance scorecard tells your operations team where to send the next order.
Scorecard vs. a carrier dashboard
Most carriers share a dashboard. It shows their view of the world, usually averages across all customers. A courier performance scorecard is different because it is built on your lanes, your pincodes and your order mix.
| Feature | Carrier dashboard | Courier performance scorecard |
|---|---|---|
| Data owner | The carrier | You |
| Scope | Carrier’s whole network | Your shipments only |
| Comparison across carriers | Not available | Built in |
| Zone and pincode detail | Often limited | Core feature |
| Drives allocation decisions | Rarely | Yes |
Who should use one
Any brand shipping through two or more carriers needs a courier performance scorecard. It matters most for D2C brands with cash on delivery (COD) orders, marketplaces with many sellers and 3PLs that manage carriers for clients. If you ship through one carrier only, a scorecard still helps you negotiate, because it gives you evidence.
Why Rate Cards Alone Mislead You
A cheap rate card hides expensive problems. A courier that is Rs 5 cheaper per parcel but loses more shipments to return to origin (RTO) can cost you more per delivered order. You only see this when you compare carriers on cost per delivered order, not cost per shipped order.
The same is true of speed. An average delivery time can look fine while a long tail of late parcels drives complaints and “where is my order” (WISMO) calls. A courier performance scorecard exposes the tail.
Hidden costs a scorecard reveals
| Hidden cost | How it appears | Scorecard metric that catches it |
|---|---|---|
| Failed delivery attempts | Extra re-attempt charges and delays | First attempt delivery rate |
| RTO | Forward and reverse freight lost, stock locked | RTO rate |
| Late delivery | Support tickets, cancellations | On-time delivery rate |
| Weight disputes | Surprise freight adjustments | Weight discrepancy rate |
| COD remittance delay | Cash tied up | COD remittance days |
| Poor tracking | WISMO calls | Tracking update lag |
For the underlying data, see how predictive delivery analytics uses delivery history to forecast performance before you ship.
The 8 Metrics Every Courier Performance Scorecard Needs
Keep the courier performance scorecard short. Eight metrics are enough for most Indian e-commerce brands. More than that and nobody reads it.
1. First attempt delivery rate
This is the share of shipments delivered on the first attempt. It is the best single signal of last-mile quality, because failed attempts feed both NDR (non-delivery report) work and RTO.
2. On-time delivery rate
Measure the share of shipments delivered on or before the estimated delivery date (EDD) shown to the customer. Use the EDD you promised, not the carrier’s own service level, or the number will flatter the carrier.
3. Average delivery time by zone
Track days from pickup to delivery for each zone pair, such as metro to metro or metro to tier 2. Average by zone, not across all lanes, because carriers are strong in some zones and weak in others.
4. RTO rate
RTO rate is the share of shipments returned to you without delivery. Split it into RTO caused by customer refusal and RTO caused by carrier failure, so you do not blame the courier for a bad order.
5. NDR resolution rate
When a delivery fails, how many of those cases does the carrier convert into a successful delivery after NDR action? A courier that responds to NDR requests quickly will carry a lower RTO rate.
6. Pickup success rate
Count the share of scheduled pickups completed on the same day. Missed pickups delay your whole promise, and they are invisible if you only measure delivery.
7. Weight discrepancy rate
Track the share of shipments where the carrier changed the billed weight. High rates point to either poor declared weights on your side or aggressive reweighing on theirs.
8. Cost per delivered order
Divide total freight, COD fees and RTO freight by the number of orders actually delivered. This is the fairest cost metric because it charges failed deliveries to the carrier that failed.
Metric reference table
| Metric | Formula | Why it matters | Review cadence |
|---|---|---|---|
| First attempt delivery rate | First attempt deliveries / shipments | Last-mile quality | Weekly |
| On-time delivery rate | Deliveries on or before EDD / deliveries | Customer promise | Weekly |
| Avg delivery time by zone | Total days / deliveries in zone | Speed by lane | Weekly |
| RTO rate | RTO shipments / shipments | Lost revenue and freight | Weekly |
| NDR resolution rate | Delivered after NDR / NDR cases | Recovery strength | Weekly |
| Pickup success rate | Same-day pickups / scheduled pickups | Dispatch reliability | Weekly |
| Weight discrepancy rate | Reweighed shipments / shipments | Billing accuracy | Monthly |
| Cost per delivered order | All freight and fees / delivered orders | True cost | Monthly |
How to Weight Your Courier Performance Scorecard
Not every metric deserves equal weight. A fashion brand with high return rates cares about different things than a B2B parts shipper. Pick weights that match your business and keep them fixed for at least a quarter, so scores stay comparable.
A sample weighting model
The weights below are illustrative. They are a starting point, not an industry standard, so adjust them to your own priorities.
| Metric | Illustrative weight (D2C with COD) |
|---|---|
| First attempt delivery rate | 20% |
| On-time delivery rate | 20% |
| RTO rate | 15% |
| NDR resolution rate | 10% |
| Cost per delivered order | 15% |
| Average delivery time by zone | 10% |
| Pickup success rate | 5% |
| Weight discrepancy rate | 5% |
| Total | 100% |
Turning raw numbers into scores
Convert each metric to a 0 to 100 score. The simplest method is to set a floor and a target for each metric. A carrier at or below the floor scores 0, a carrier at or above the target scores 100, and anything between is scaled in proportion.
Then multiply each score by its weight and add them up. The total is the carrier’s courier performance scorecard rating for the period.
A Worked Example (Illustrative Numbers)
The numbers below are hypothetical and exist only to show the arithmetic. They are not benchmarks for any real carrier. Assume three carriers, called Carrier A, B and C, each handling 1,000 shipments in the same month.
| Metric | Carrier A | Carrier B | Carrier C |
|---|---|---|---|
| First attempt delivery rate | 82% | 76% | 88% |
| On-time delivery rate | 85% | 80% | 90% |
| RTO rate | 11% | 15% | 8% |
| Freight per shipment (Rs) | 62 | 55 | 70 |
| RTO freight per RTO shipment (Rs) | 62 | 55 | 70 |
Cost per delivered order is shipped freight plus RTO freight, divided by delivered orders, and here every shipment that is not an RTO counts as delivered. Ignoring other fees, Carrier A costs about Rs 77 per delivered order, Carrier B about Rs 74 and Carrier C about Rs 82.
Carrier B looks cheapest on the rate card and also on cost per delivered order here, but it has the weakest delivery rates and the highest RTO. Carrier C costs the most yet delivers best. A weighted courier performance scorecard lets you decide how much extra freight is worth paying for a better first attempt rate, rather than guessing.
Chart: illustrative weighted scores
The chart below scores the four metrics in the table using the illustrative weights, rescaled to 100%. Floors and targets are also hypothetical: first attempt rate 70% to 90%, on-time rate 70% to 95%, RTO rate 20% to 5%, and cost per delivered order Rs 90 to Rs 60.
Carrier C scores highest once failed deliveries are charged to the carrier
Weighted score out of 100. Hypothetical data, four metrics rescaled to 100%.
Step-by-Step: Build Your Courier Performance Scorecard
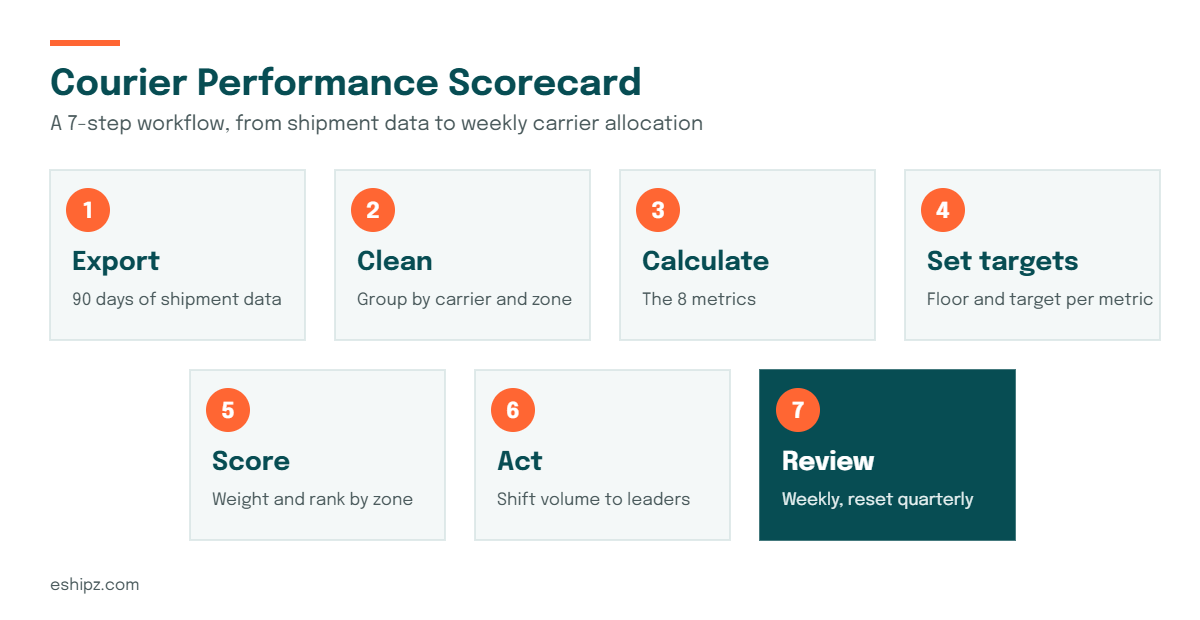
You can build your first courier performance scorecard in a spreadsheet in a few hours. Follow these steps in order.
Step 1: Export 90 days of shipment data
Pull every shipment with order ID, carrier, pickup date, delivery date, EDD, status, attempt count, RTO flag, billed weight, declared weight and freight charges. Ninety days smooths out one-off spikes.
Step 2: Clean and group the data
Remove cancelled orders and test shipments. Group the rest by carrier and by zone. Zone-level grouping is what makes the scorecard useful, so do not skip it.
Step 3: Calculate the eight metrics
Use the formulas in the reference table. Calculate each metric per carrier and per zone, then keep an all-zone view for the summary.
Step 4: Set floors and targets
Choose a floor and a target for each metric using your own history. If you have no history, use your best carrier’s result as the target and your worst as the floor, and refine later.
Step 5: Score and rank
Apply the weights, add up the scores and rank carriers within each zone. A carrier can rank first in one zone and last in another, and that is exactly what you want to see.
Step 6: Act on the ranking
Shift volume toward the carriers that score higher in each zone. Cap carriers that score low rather than dropping them, so you keep a backup for peak season.
Step 7: Review weekly, reset quarterly
Refresh the courier performance scorecard every week and review the trends monthly. Reset weights and targets once a quarter.
From Scorecard to Action: Allocation Rules
A scorecard is only useful if it changes how orders are assigned. Turn the ranking into simple rules that your team or your software can apply to every order.
| Scorecard signal | Allocation rule | Review trigger |
|---|---|---|
| Carrier ranks first in a zone | Give it the largest share of that zone | Score drops two weeks in a row |
| Carrier ranks last in a zone | Cap its share in that zone | Score improves for four weeks |
| Carrier has high COD RTO | Route prepaid orders to it, COD elsewhere | RTO falls below your target |
| Carrier misses pickups | Move same-day dispatch volume away | Pickup success recovers |
| Carrier has high weight disputes | Audit declared weights and raise the issue | Discrepancy rate drops |
If you ship through several carriers, multi-carrier shipping software can apply these rules automatically at the point of order, so volume moves without manual effort.
Data Quality Checklist for a Reliable Scorecard
A courier performance scorecard is only as good as the data behind it. Check these points before you trust any ranking.
- Use the same date definitions for every carrier. Delivery date should mean the date of final delivery, not the date of last scan.
- Tag every RTO with a reason. Customer refusal and carrier failure need separate counts.
- Record the EDD you showed the customer at checkout, not the one the carrier updated later.
- Compare carriers on matched lanes. A carrier that handles harder remote pincodes will look worse unless you compare like with like.
- Keep a minimum sample size per zone. Scores based on a handful of shipments can swing wildly, so hold those zones out until volume builds.
- Store declared weight and billed weight for every shipment so discrepancy rates are traceable.
Common Mistakes When Using a Courier Performance Scorecard
Teams often build a scorecard and then misuse it. These mistakes show up again and again.
Judging carriers on averages alone
An overall average hides weak zones. Always view the courier performance scorecard by zone before changing allocation.
Changing weights too often
If you change weights every month, scores stop being comparable and you cannot tell whether a carrier improved. Hold weights for a quarter.
Blaming the carrier for customer behavior
A COD refusal is not always the courier’s fault. Separate RTO reasons or you will penalize the wrong party.
Ignoring sample size
A carrier with 20 shipments in a zone can score 100 or 0 by chance. Set a minimum volume before you rank.
Dropping a carrier too fast
A low score is a reason to cap volume and ask for improvement. Keep a backup carrier for peak periods, when capacity matters more than price.
Never sharing results with carriers
Carriers respond to data. Share the courier performance scorecard in your monthly review and agree on improvement targets in writing.
Benchmarks and Targets: How to Set Your Own
Public benchmarks for Indian courier performance vary widely by source, product and period, so this guide does not quote them. Build your own targets from your own history instead.
Start with your best carrier’s result in each zone over the last 90 days. Set that as the target for every other carrier in the same zone. Then raise the target a little each quarter as your overall performance improves.
| Target-setting step | What to do |
|---|---|
| Baseline | Use the last 90 days of your own data |
| Target | Best carrier result in the zone |
| Floor | Worst acceptable result before volume is capped |
| Review | Reset each quarter |
KPI Table: What to Track Alongside the Scorecard
The courier performance scorecard sits beside a few wider operating KPIs. Track these to see whether scorecard actions are working.
| KPI | What it tells you | Direction you want |
|---|---|---|
| Overall RTO rate | Whether allocation changes cut returns | Down |
| WISMO tickets per 100 orders | Whether tracking and speed improve | Down |
| Cost per delivered order (blended) | Whether savings hold after switching | Down |
| Share of volume with top-ranked carrier per zone | Whether you act on the ranking | Up |
| Repeat purchase rate | Whether delivery experience affects loyalty | Up |
How eShipz Helps You Run a Courier Performance Scorecard
Building the scorecard in a spreadsheet works for the first quarter. After that, the manual export and cleaning become the bottleneck. eShipz is a shipping automation platform that connects multiple carriers in one place, so shipment, tracking and exception data from different couriers can be viewed together instead of in separate carrier portals.
Teams use eShipz for multi-carrier booking, carrier allocation, tracking, NDR management and delivery analytics. Those are the same data points a courier performance scorecard needs. Please confirm which reports and allocation rules are available on your plan before you rely on them.
A simple way to start
Run your first scorecard manually on 90 days of data. Use it to find your two strongest and two weakest carrier and zone combinations. Then test shifting a small share of volume and measure the change in first attempt delivery rate and RTO over the next month.
If you want to see how a connected shipping platform can feed the metrics above, explore eShipz and its multi-carrier tools.
Conclusion
A courier performance scorecard replaces opinion with evidence. It shows which carriers deliver, which ones cost you more than their rate card suggests and where to send each order. With eight metrics, a fixed set of weights and a weekly review, you can build a courier performance scorecard in days and keep improving it every quarter.
Start small. Pull 90 days of data, score your carriers by zone and move a modest share of volume to the leaders. As the market grows toward the volumes Bain projects, the brands that measure their carriers will be the ones that keep delivery cost and customer experience under control.
Frequently Asked Questions
1. What is a courier performance scorecard?
A courier performance scorecard is a table that rates each carrier on the same metrics, such as first attempt delivery, on-time delivery, RTO and cost per delivered order. It uses your own shipment data so you can compare carriers fairly and decide how to split volume.
2. How often should I update my courier performance scorecard?
Refresh it weekly for operational metrics such as delivery rate and RTO, and review cost and weight metrics monthly. Reset weights and targets once a quarter so scores stay comparable.
3. Which metrics matter most on a courier performance scorecard?
First attempt delivery rate, on-time delivery rate, RTO rate and cost per delivered order matter most for most e-commerce brands. Add NDR resolution, pickup success, average delivery time by zone and weight discrepancy rate for a full view.
4. Can small businesses use a courier performance scorecard?
Yes. A small business can build one in a spreadsheet using a 90-day export. It works even with two carriers, and it gives you evidence to negotiate rates and service levels.
5. How do I score carriers fairly across different zones?
Compare carriers within each zone, not across your whole network. Use a minimum shipment count per zone before ranking, and hold weak-sample zones out until volume builds.
6. Should I drop the lowest-scoring carrier?
Usually not at first. Cap its volume, share the scorecard and set an improvement target. Keep a backup carrier for peak season and for zones where it still performs well.
7. Can software automate a courier performance scorecard?
Yes. Multi-carrier shipping platforms can combine tracking and exception data from several carriers and apply allocation rules automatically. Check which analytics and allocation features your platform offers before you plan around them.