





Picture a normal Tuesday for an online brand. The support inbox fills with “Where is my order?” messages. One parcel sits at a hub two days past its promised date. Another failed its first attempt because the address had no landmark. A cash on delivery order will be refused at the door and return to your warehouse as an RTO. Predictive delivery analytics is the practice of spotting each of these outcomes while the parcel is still in transit, early enough to act on them.
Most brands still work in the opposite order. They learn about a delay from an angry customer, or from a carrier status that has already turned red. By then the customer has decided how they feel about you, whether or not the parcel eventually arrives. Delivery performance has become a growth lever because it decides whether a first-time buyer orders again, how many support tickets you pay for, and how much freight you spend on parcels that come back.
The industry is already moving. McKinsey’s 2026 State of Digital Logistics survey found that nearly 90 percent of shippers have adopted at least one transportation AI use case. It also found that the companies getting returns from AI move analysis into everyday operating decisions and tie those decisions to execution. That second finding matters most for delivery teams. A forecast only helps if a person or an automation acts on it.
This guide covers what predictive delivery analytics is, why it matters, how it works, which metrics to track, how to start without a data science team, and how eShipz approaches it.
What Is Predictive Delivery Analytics?
Predictive delivery analytics uses historical and real-time shipping data, plus machine learning, to forecast delivery outcomes before they happen. Those outcomes include delays, failed delivery attempts, RTO risk and the estimated delivery date for each shipment.
It sits inside the wider field of predictive analytics in logistics, which also covers demand forecasting, fleet maintenance and warehouse capacity. Predictive delivery analytics narrows the focus to the parcel and asks three questions: will it arrive, when, and what could go wrong on the way?
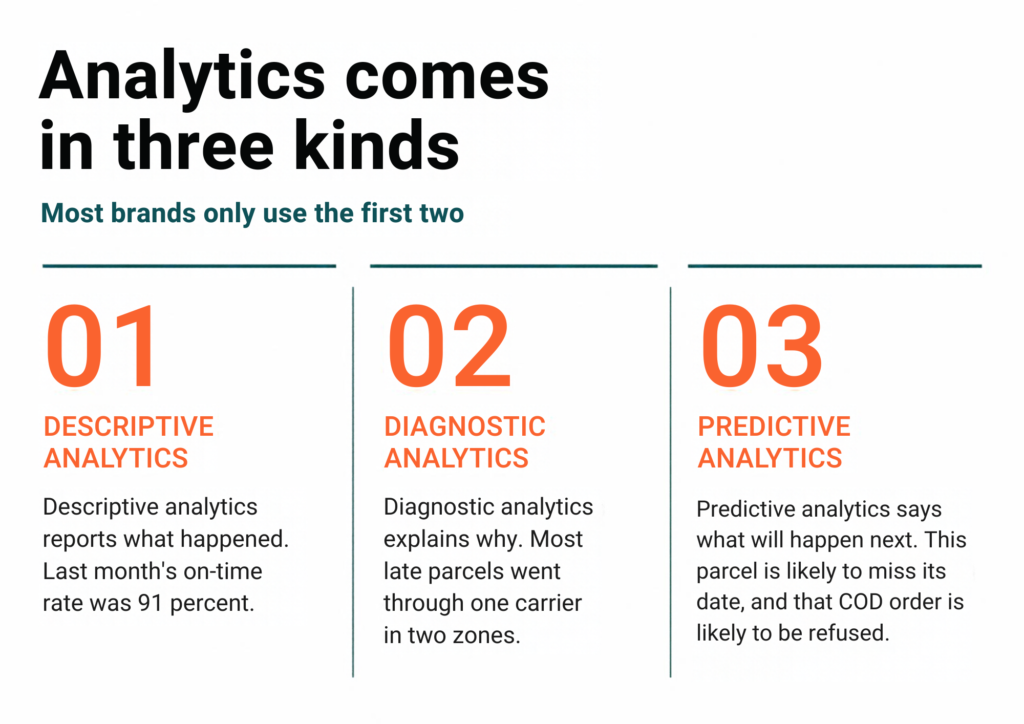
Analytics comes in three kinds, and most brands only use the first two:
- Descriptive analytics
- Diagnostic analytics
- Predictive analytics
What data does it use?
The models learn from carrier scan events, pincode-level delivery performance, order value, payment mode (COD or prepaid), weather, seasonality, address quality and past delivery attempts. No single input predicts much on its own. The value comes from combining them. A COD order with a thin address going to a pincode with a poor record is a very different risk from a prepaid order going to a metro.
Traditional tracking vs predictive delivery analytics
| Question | Traditional tracking | Predictive delivery analytics |
|---|---|---|
| What it tells you | Where the parcel is and what the carrier last scanned | What is likely to happen to the parcel next |
| Timing | After an event happens | Before an event happens |
| Estimated delivery date | A fixed carrier promise | A forecast that updates with live scans and past results on that lane |
| Delays | Seen once the date is missed | Flagged while the shipment still looks on time |
| Failed deliveries and RTO | Counted after the fact | Scored as a risk before or soon after dispatch |
| Carrier choice | Rate card and habit | Past results by pincode, lane and season |
| Customer messages | Replies to “where is my order” queries | Alerts sent before the customer asks |
| Team workload | Checking every shipment | Reviewing the flagged exceptions |
A caution when you compare tools: many products labelled predictive pass the carrier’s own estimate straight through. Ask where the estimated delivery date comes from. If a model trained on shipment history produces it, that is delivery prediction. If it is the carrier’s number with a new label, it is tracking.
For the wider picture of how logistics analytics covers carriers, warehouses and returns, eShipz has a separate guide on logistics analytics for smarter ecommerce delivery.
Why Predictive Delivery Analytics Is Essential
Five problems explain why brands are adding delivery analytics to their shipping operations.
1. Customers expect speed, accurate dates and updates. DHL’s 2025 E-Commerce Trends Report surveyed 24,000 shoppers in 24 markets. It found that 81 percent of shoppers abandon a purchase when their preferred delivery option is missing, and three in four will not buy from a retailer they do not trust to deliver and handle returns. Business impact: one bad delivery can cost you the next order.
2. Failed deliveries and RTOs eat margin. Shipway’s FY25 analysis, cited by Amazon Shipping India, reports about 26 percent RTO on COD or non-prepaid orders, against under 2 percent for prepaid. Each failed attempt adds a reattempt, a support contact and often a return trip. Business impact: shipping is often one of the largest costs a brand can still control.
3. Carrier performance is uneven. A carrier can be quick in Bengaluru and slow in a tier-3 town, or reliable in March and stretched in festive weeks. Network averages hide this. Business impact: you pay for reliability you do not get on specific lanes.
4. Reactive tracking cannot save the order. A “delayed” status arrives after the damage starts. The same Shipway analysis found an RTO rate of 22 percent when the first attempt happened within one to two days, and 35 percent when it took more than five. Slow parcels get returned more often. Business impact: every day a delay goes unnoticed raises the odds of losing the sale.
5. Manual analysis stops working at scale. A spreadsheet is fine at 50 orders a day. It is useless at several thousand orders, a handful of carriers and thousands of pincodes. Business impact: patterns stay hidden while costs build up.
Market Trends Shaping Predictive Logistics Analytics
Six shifts are pushing brands toward predictive logistics analytics:
- E-commerce keeps growing, especially in India. BCG estimates that India has nearly 300 million online shoppers and expects 440 million by 2030. It projects the market growing from USD 120-140 billion to USD 280-300 billion over the same period, according to coverage in the Economic Times. More buyers in more pincodes means more variation in delivery results.
- AI is now ordinary in logistics. In the McKinsey survey, 88 percent of shippers said their transportation AI and digital use cases met or exceeded expectations.
- Multi-carrier strategies are the norm. Brands split volume across carriers and benchmark them by lane instead of trusting a single partner.
- Proactive communication is replacing carrier-site tracking. Branded tracking pages and WhatsApp or SMS updates answer the customer before they ask.
- RTO and COD risk dominate Indian shipping. Roughly 60 to 65 percent of Indian e-commerce orders are COD, per ET Prime Research as cited in the Amazon Shipping India piece above. That makes COD risk scoring a core job for delivery analytics.
- Teams want one dashboard.
Key Benefits and Outcomes of Predictive Delivery Analytics
- Higher on-time delivery rate. Orders go to the carrier with the best record for that lane and season, instead of the cheapest one.
- Fewer failed deliveries and NDRs. At-risk shipments are flagged early, so the address gets verified or the customer gets a heads-up before the first attempt.
- Lower RTO and shipping costs. Fewer returning parcels means less reverse freight, handling and write-off.
- Better customer experience. An accurate estimated delivery date and proactive alerts set realistic expectations.
- Fewer WISMO tickets. Customers who already know about a delay rarely write in about it.
- Data-backed carrier negotiations. You can bring lane-level on-time and RTO numbers to the table instead of impressions.
- Better cash flow, especially for COD. The money arrives only when delivery succeeds, so every saved delivery shortens the cash cycle.
A hypothetical before and after. The numbers below are illustrative, not a customer result. A fashion brand ships 1,000 COD orders a day. Before: on-time delivery is 88 percent and the COD RTO rate is 30 percent, so 300 parcels return every day. After three months of scoring COD risk, confirming risky orders on WhatsApp and moving weak pincodes to better carriers: on-time delivery is 93 percent and COD RTO is 24 percent, so 240 parcels return. That is 60 fewer returns a day, about 1,800 a month, along with the freight, handling and waiting time each one carries.
How Predictive Delivery Analytics Works
The process runs as a loop:
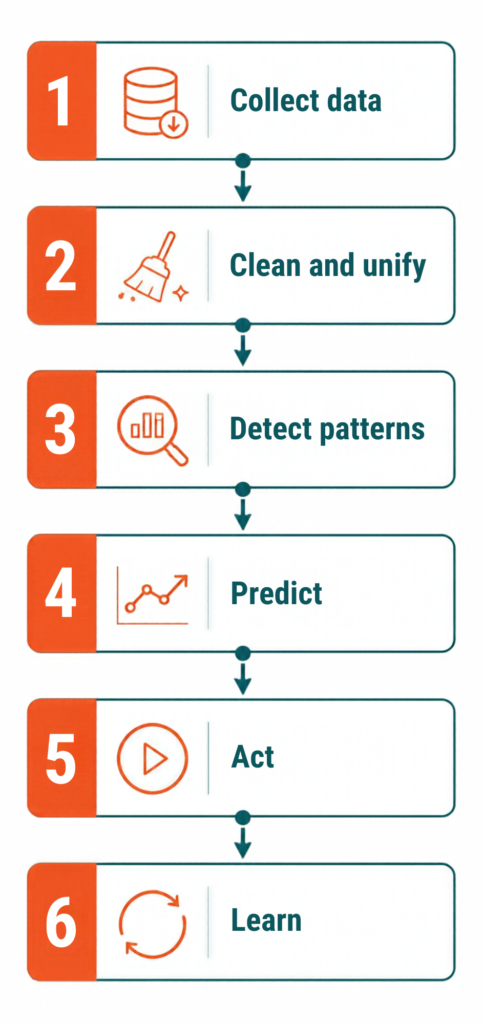
- Data collection. The system gathers orders, carrier scan events, NDR reasons, delivery attempts and final outcomes. Every shipment adds one more example of what happened.
- Data cleaning and unification. Carriers describe the same event in different words. One writes “Out for delivery,” another sends a code. The data has to be mapped into a single format, with pincodes, timestamps and duplicates fixed.
- Pattern detection. The model looks for trends by pincode, lane, carrier and time. A carrier may slow down in festive weeks. One pincode may have a high refusal rate on COD orders.
- Prediction. The output is a delay probability, an updated estimated delivery date, and an RTO or NDR risk score. Say a first-time buyer places a COD order of Rs 1,499 to an incomplete address in a pincode with a weak refusal history. That order scores high.
- Action. The system reroutes the order, switches the carrier, asks for an address check, alerts the customer or escalates to the carrier. A prediction with no action attached is only a report.
- Feedback loop. Real outcomes flow back in. The model’s forecasts get sharper as results accumulate, and rules that stopped working get exposed.
The usual alternative is a static rule, such as “always use the cheapest carrier.” eShipz’s guide to predictive logistics and rule-based shipping decisions explains where those rules break down.
Key Metrics to Track to Improve Delivery Performance
| Metric | Why it matters |
|---|---|
| On-time delivery (OTD) % | The headline measure of delivery performance. It shows how many promises you kept. |
| First attempt delivery success rate | Each failed first attempt adds cost and raises RTO risk. |
| NDR rate and NDR resolution rate | Shows how many shipments hit trouble and how many you recover before they return. |
| RTO % | The clearest cost of failed delivery. Split it by COD and prepaid. |
| Average delivery TAT by lane and pincode | A network average hides the slow lanes. |
| Carrier-wise performance score | Combines on-time rate, first attempt success, RTO and TAT into one comparison per carrier. |
| Cost per delivery | Include reattempts, RTO freight and support cost, not only the freight bill. |
| Customer complaint and WISMO rate | Shows what delivery feels like from the customer’s side. |
Where Can You Start? A Practical Roadmap
- Audit your current delivery performance. Record baseline OTD, RTO, NDR and TAT for the last 90 days, split by carrier and payment mode.
- Centralize your shipping data. Bring all carriers into one platform instead of separate portals and spreadsheets.
- Define your goals. For example, cut RTO by 15 percent or lift on-time delivery to 95 percent. A target turns analysis into a decision.
- Start with carrier and pincode analysis. List your worst-performing lanes by volume. Ten bad pincodes with high order counts usually explain a large share of the trouble.
- Set up automated rules. Cover carrier allocation, address validation and COD risk checks.
- Enable proactive customer communication. Use a tracking page and WhatsApp, SMS or email updates, and send a revised estimated delivery date when the forecast changes.
- Review weekly, then optimize. Hold a short weekly review and change one rule at a time so you can tell what worked.
Common mistakes to avoid
- Poor data quality. Unmapped statuses and wrong pincodes produce wrong predictions.
- Tracking too many metrics. Five metrics that someone owns beat twenty that nobody reads.
- No action plan. A risk score without an owner or a rule changes nothing.
- Changing many rules at once. You will not know which change helped.
How eShipz Helps You Improve Delivery Performance with Predictive Analytics
eShipz is a multi-carrier shipping and logistics automation platform used by 350+ brands. Predictive delivery analytics needs three things: unified data, forecasts and a way to act on them. Here is how eShipz capabilities line up with the problems covered above.
- Scattered carrier data: multi-carrier integration and a single dashboard. Shipments from all connected carriers appear in one place, with unified tracking, through the multi-courier shipping API and the Control Tower and Dashboard.
- Uneven carrier performance: courier allocation. CarrierSmart AI allocates couriers using SLA performance, cost scoring and delivery efficiency, so orders follow results instead of a fixed preference list.
- Vague delivery promises: estimated delivery date and ETA. PredictShip ETA and Track360 combine real-time tracking with AI-driven delivery prediction.
- WISMO tickets: real-time tracking and proactive alerts. Track360 and PostShip Engage keep customers informed through tracking pages and notifications.
- Failed deliveries: NDR management and redelivery. Automated NDR workflows and ReDelivR help resolve failed attempts before the parcel heads back.
- COD exposure: COD management. COD orders get their own handling, since payment depends on a successful delivery.
Reports and dashboards bring on-time delivery, RTO, TAT and cost into view, so the weekly review in the roadmap above has numbers to work from.
See how eShipz can improve your delivery performance. Book a demo.
Challenges and Best Practices
Challenges you will meet
- Data silos. Order data sits in one system, carrier data in another and returns data in a spreadsheet.
- Inconsistent carrier data. Status names differ, scans arrive late and some events never arrive at all.
- Change management. Ops teams need to trust the flags and change their routines to act on them.
- Expecting instant results. Forecasts improve with data. Treat the first month as calibration.
Best practices that help
- Start small. Pick one lane or one COD segment and prove the result there.
- Clean your data first. Fix status mapping and pincodes before you judge any prediction.
- Combine automation with human review. Let rules handle clear cases and let people check high-value or unusual orders.
- Review regularly. Look at results weekly, and again after every sale season.
The Future of Predictive Delivery Analytics
Expect three changes. Routing will adjust itself as conditions shift, and ETAs will become hyperlocal, down to a pincode and a time slot. Exception handling will also become automatic, with the system raising and chasing a carrier ticket without a person in the loop. Delivery options will get more personal too: shoppers may see slots or pickup points ranked by predicted reliability. Fewer failed attempts and tighter routes also mean fewer wasted kilometres, which helps sustainability goals.

Conclusion
Predictive delivery analytics turns delivery from a cost you absorb into something you can plan. It shows which parcels are in trouble while there is still time to fix them. The outcome is fewer delays and RTOs, happier customers and lower shipping costs.
You do not need a data science team to begin. Baseline your numbers, bring your carriers onto one platform and fix your worst lanes first. To see how this fits your carrier mix, explore eShipz or book a demo.
FAQs
What is predictive delivery analytics?
Predictive delivery analytics uses historical and live shipping data with machine learning to forecast what will happen to a shipment. It estimates delay risk, the likely delivery date, and the chance of a failed delivery or RTO. Teams use those forecasts to act while the parcel is still moving.
How does predictive analytics improve delivery performance?
It flags at-risk shipments early, so you can switch carriers, verify addresses or warn the customer before a problem lands. It also shows which carriers perform best on each pincode and lane. That raises on-time delivery and cuts failed attempts and returns.
Which metrics should I track to improve delivery performance?
Start with on-time delivery rate, first attempt delivery success, NDR and RTO rates, average TAT by lane, carrier-wise performance, cost per delivery and WISMO rate. Segment each one by carrier, pincode and payment mode, because network averages hide the slow lanes.
Can small businesses use predictive delivery analytics?
Yes. Small brands do not need their own data science team. A shipping platform that unifies carrier data and applies forecasts and rules can do the heavy lifting. Begin with a baseline, one clear goal such as lower COD RTO, and a weekly review.
How can I reduce RTO and NDR using analytics?
Score COD orders for risk before dispatch, and confirm the risky ones by WhatsApp or call. Move weak pincodes to carriers with better records, validate incomplete addresses, and send proactive updates. For failed attempts, automate NDR follow-up so customers respond quickly and the reattempt happens fast.
How is predictive delivery analytics different from shipment tracking?
Tracking reports where a parcel is and what the carrier last recorded. Predictive delivery analytics forecasts what is likely to happen next, such as a missed date or a refused COD order. Tracking tells you about trouble afterward. Prediction gives you time to prevent it.
How accurate is delivery prediction?
Accuracy depends on the volume and quality of your shipment data, your carrier mix and how many pincodes you cover. Forecasts usually improve as more outcomes feed back into the model. When you evaluate a vendor, ask for accuracy figures on your own lanes, not only a network average.